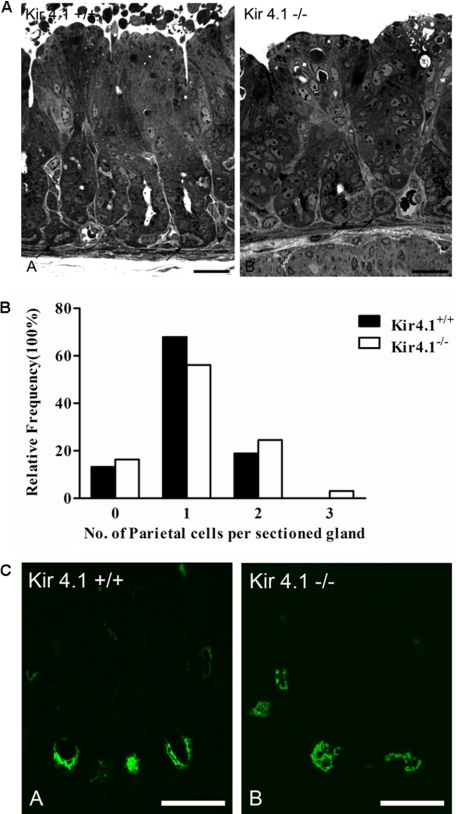
FIGURE 3.
A, light microscopy of semithin sections of Kir4.1+/+ and Kir4.1−/− stomach mucosae. In both genotypes, droplets of varying size can be observed in the cells directly lining the lumen, indicative of milk absorption. Some of the PCs in the young mice were also found at the base of the glands. B, relative frequency distribution of the number of PCs in sections of gastric glands did not differ between Kir4.1+/+ and Kir4.1−/− mice (a total of three pairs was analyzed). C, confocal images of semithin sections of WT and KO gastric mucosae labeled with mouse monoclonal antibody against H+/K+-ATPase. No obvious difference in the fluorescence intensity between the +/+ and −/− genotypes was seen. Scale bars = 25 μm. Five total pairs of Kir4.1−/− and WT stomachs were analyzed.

