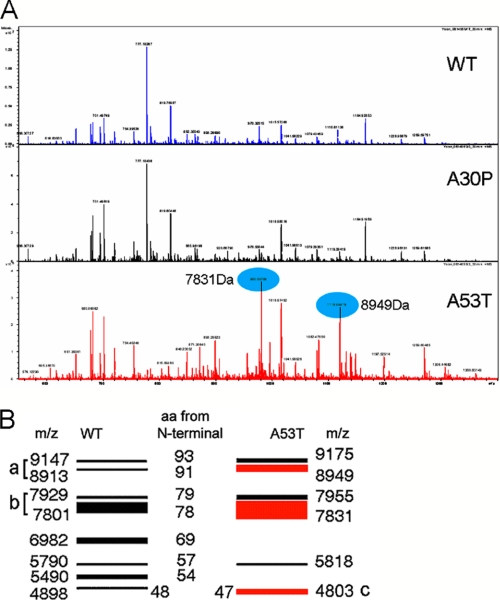
FIGURE 3.
Mass spectrometric analysis of peptides generated from both WT and mutants form of α-synuclein by cMMP3 cleavage. A, after 30 min of incubation with cMMP3 (1 μg/ml), peptides from WTsyn, A30Psyn, and A53Tsyn (1 μg each) were analyzed by Fourier transform-ion cyclotron resonance mass spectrometry. Blue ovals represent two strong peaks generated exclusively in A53Tsyn. B, amino acid sequences and intensity determined accordingly with deconvoluted m/z values and N-terminal amino acids. Note that band a consists of two peptides (1–93 and 1–91 aa), and band b also consists of two (1–79 and 1–78 aa). Band c is one peptide of 1–47 aa, which is exclusively generated from A53T.

