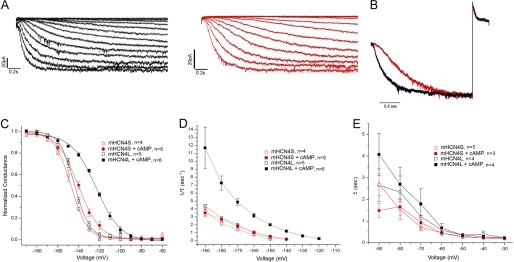
FIGURE 2.
Comparison of activation and inactivation properties of the two mHCN4 variants. A, representative activation currents of mHCN4L (left panel) and mHCN4S (right panel) elicited by 2.5-s voltage steps from −60 to −190 mV in 10-mV increments. Both recordings shown were performed with 100 μm cAMP in the intracellular solution. B, representative normalized mHCN4L (black) and mHCN4S (red) currents activated at −160 mV and then deactivated at +30 mV with cAMP present showing the difference in the speed of activation, but not in deactivation. The differences between time constants of the representative traces and the group averages are <1%. C, conductance-voltage relationships of the mHCN4 channels with or without 100 μm cAMP. D, activation time constants of the two mHCN4 channels with or without cAMP. E, deactivation time constants of the two mHCN4 channels with or without cAMP.

