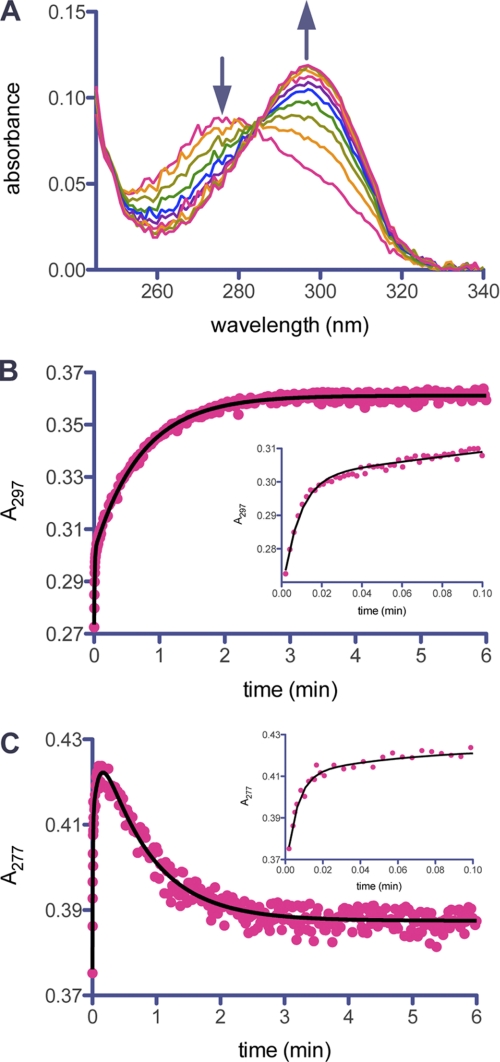
FIGURE 2.
UV detection of enamine intermediates during inhibition of GES-2 by tazobactam. A, the UV difference spectra of GES-2 (5 μm) inhibition by tazobactam (500 μm) over 10 min. The arrows indicate the disappearance of the trans-enamine species (λmax = 277 nm) and the appearance of the cis-enamine species (λmax = 297 nm). B, the time course for formation of the cis-enamine species monitored at 297 nm. The line represents the best fit for Equation 3, which describes two exponential processes. The inset shows the initial exponential growth phase. C, the time course for formation of the trans-enamine species monitored at 277 nm. The line represents the best fit for Equation 4, which describes three exponential processes. The inset shows the initial exponential growth phase. The plot of residuals for the nonlinear fit of data for the indicated equation can be found in supplemental Fig. S1.

