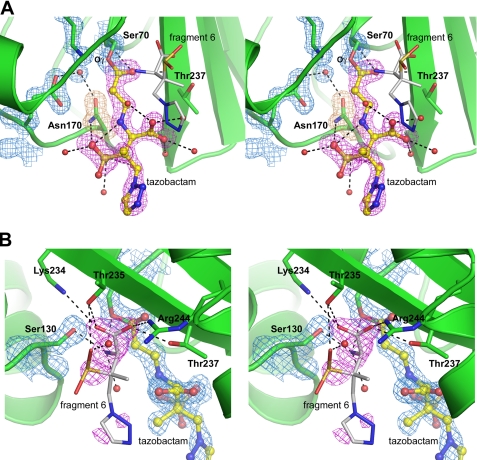
FIGURE 5.
The active site of the GES-2·tazobactam complex. A, stereoview of the electron density in the active site of the GES-2·tazobactam complex, showing the final 2Fo − Fc electron density for the protein (blue, contoured at 1.5 σ) and the initial Fo − Fc electron density prior to refinement (magenta, contoured at 3.5 σ) modeled as either the trans-enamine (5) or imine (3) species (yellow ball-and-stick) covalently attached to Ser70. The Fo − Fc electron density for Asn170 (brown) is also shown. Water molecules are represented as red spheres, black dashed lines indicate hydrogen bonds, and hydrolysis fragment 6 is shown in white. B, stereoview of the residual Fo − Fc electron density (magenta) near Ser130 and the partially occupied hydrolysis fragment 6 (white sticks). Hydrogen bonding interactions with this fragment are indicated.

