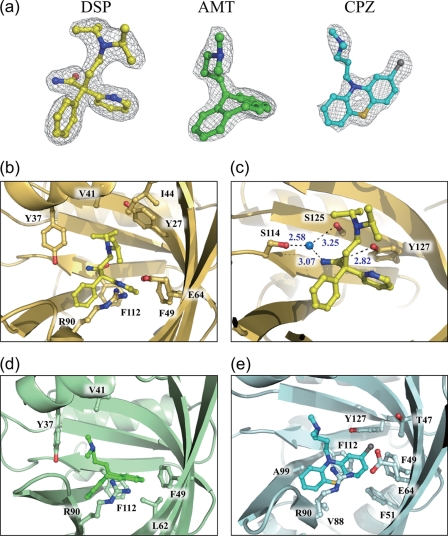
FIGURE 2.
Interactions of DSP, AMT, and CPZ with the A variant. a, 2Fo − Fc electron density maps of DSP, AMT, and CPZ in the complex structures, contoured at 1.2σ. b, structure of the binding pocket in the A variant-DSP complex. c, structure of the binding pocket in the A variant-DSP complex. A water molecule is depicted as a blue sphere, and hydrogen bonds are indicated as black dotted lines. d, structure of the binding pocket in the A variant-AMT complex. e, structure of the binding pocket in the A variant-CPZ complex. DSP, AMT, and CPZ molecules are depicted as yellow, green, and cyan, respectively.

