FIGURE 3.
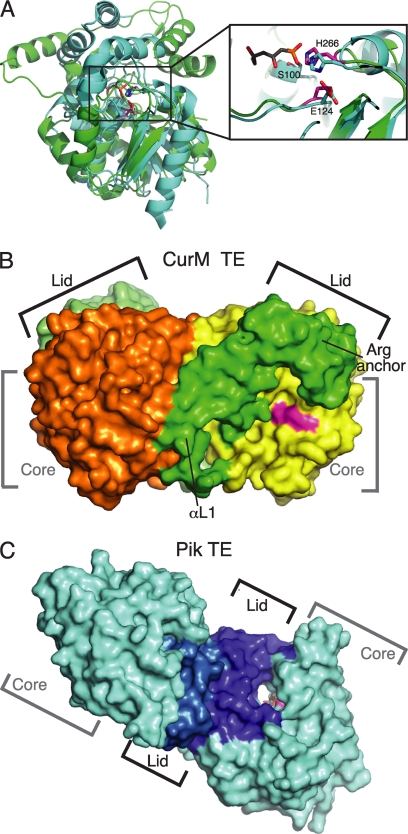
Comparison of curacin and pikromycin TEs. A, structure alignment of the core of CurM TE (green) and Pik TE (cyan, Protein Data Bank code 2H7X, (12)) (root mean square deviation = 1.5 Å for 95 Cα atoms). Both structures have the conserved α/β-hydrolase core, but the lids differ. The zoom view shows the active site conservation in the catalytic triad of CurM TE (magenta) and Pik TE (cyan) with a triketide affinity label (gray). The view is similar to Fig. 2A. B, surface representation of the CurM TE dimer. The primary dimer contact is between the lid (subunits in two shades of green) and core (subunits in yellow and orange). The active site (magenta) is in an open cleft between the core and lid. C, surface representation of the Pik TE dimer. The dimer contact is exclusively between the lid subdomains (subunits in two shades of blue) with no contacts of core domains (cyan). The active site (magenta) with an affinity label (gray sticks) is at the center of an open-ended tunnel (12). The views in B and C highlight the differences in active site access, which are distinct for the CurM TE and Pik TE enzymes.

