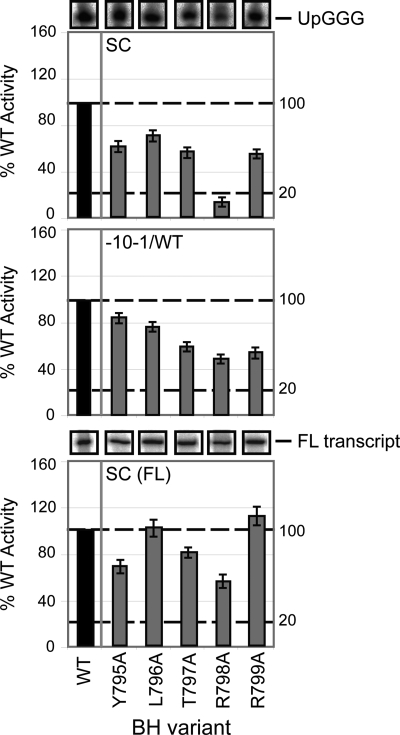
FIGURE 3.
Promoter-dependent transcription activities of BH residues 795–799. The bar graphs depict the relative intensities (expressed as a percentage of WT RNAP activity, where WT = 100%) of the σ54-dependent products formed on the supercoiled (SC; upper panel), pre-opened (mismatched between positions −10 and −1 (−10−1/WT); middle panel) and supercoiled (full-length transcripts (FL); lower panel) templates in the presence of the BH variants Y795A, L796A, T797A, R798A, and R799A. Gel slices of the corresponding small primed RNA (UpGGG) and full-length (FL transcript) products (obtained using the supercoiled template) are shown above the respective bar graphs. Black bars represent WT (100%) activity. All assays were performed at least three times, and S.D. values are shown.

