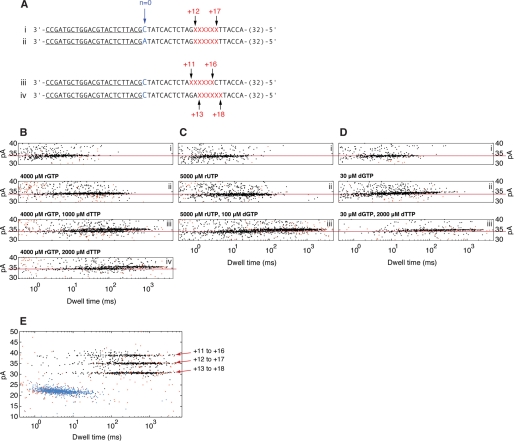
FIGURE 4.
Current amplitudes for KF-DNA complexes formed with complementary rNTP or dNTP captured on the nanopore. A, primer/template DNA substrates used to compare the amplitudes of KF-DNA complexes. Key features of the template strands that permit complexes to be distinguished in the experiments are the identity of the residue at N = 0 (highlighted in blue) and the position of a block of six abasic (1′,2′-H) residues. The abasic residues are shown as red Xs, and their position in the template strands relative to the N = 0 residue is indicated above the sequences. Forty-seven residues starting from the 3′-end of each of the template strands are shown. The binding site for the 23-mer 3′-H-terminated primer is underlined. Complete sequences for all of the DNA substrates used in this study are shown in supplemental Fig. S1. B, C, and D show dwell time versus amplitude plots of the EBS populations from individual experiments with the plots for data files collected after each of a series of sequential substrate additions labeled above each subpanel. The three experiments in B, C, and D started with the same components in the nanopore chamber; that is, subpanels i in B, C, and D each had 2 μm KF and a 1 μm concentration of each of the primer/template substrates in A (i and ii). The subsequent additions in the experiment in B were 4000 μm rGTP (ii), 1000 μm dTTP (iii), and an additional 1000 μm dTTP to a final concentration of 2000 μm dTTP (iv). In the experiment in C, the additions were 5000 μm rUTP (ii) and 100 μm dGTP (iii). In the experiment in D, the additions were 30 μm dGTP (ii) followed by 2000 μm dTTP (iii). The red lines across the panels are placed through the lower amplitude population clusters (KF-DNA and KF-DNA-complementary rNTP complexes) as a visual guide. The amplitude range in B–D is restricted to 30–40 pA to highlight the EBS events. Dwell time versus amplitude plots for the experiments in B–D showing the amplitude range between 0 and 50 pA, which includes the terminal steps from the EBS events and the unbound DNA events, are shown in supplemental Fig. S3. Supplemental Fig. S3 also includes the initial steps from the experiments in B–D, showing the binary complexes formed with the two DNA substrates individually and confirming that these binary complexes have the same EBS amplitude. E, dwell time versus amplitude plot for KF-DNA complexes captured in the presence of 3 μm KF, 300 μm dGTP, and a 1 μm concentration of each of the primer/template substrates in A (i, iii, and iv). The KF-DNA-dNTP ternary complex populations corresponding to each of the three DNA substrates are labeled; assignment of the populations was determined in experiments in which the DNA substrates were added to the nanopore chamber sequentially (not shown).

