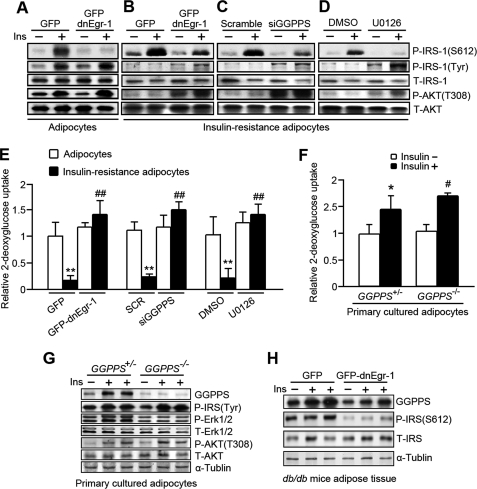
FIGURE 6.
The Egr-1/GGPPS/Erk1/2 pathway promotes insulin resistance by phosphorylating IRS-1 at Ser612. A–D, non-IR adipocytes and IR adipocytes were infected with GFP-dnEgr-1 (A and B) or GGPPS siRNA adenovirus for 48 h (C) or treated with U0126 for 2 h (D). Insulin treatment was performed 3 h, and the cells were subjected to Western blot analysis. E, non-IR adipocytes and IR adipocytes were infected with GFP-dnEgr-1 adenovirus or GGPPS siRNA for 48 h or treated with U0126 for 2 h. Insulin and [3H]d-glucose treatment was performed for 3 h. The cell lysates were assessed for glucose uptake. The relative glucose uptake of IR adipocyte was compared with normal adipocytes infected with GFP control adenovirus or scrambled adenovirus or treated with dimethyl sulfoxide (DMSO). F, glucose uptake measurement of the primary cultured adipocytes from GGPPSloxP/loxP aP2-Cre+/− (GGPPS−/−) and GGPPSwt/loxP aP2-Cre+/− (GGPPS+/−) mice. The primary cultured adipocytes were pretreated with insulin (1000 nm) and [3H]d-glucose (200 μCi/mmol/liter) for 3 h and subjected to glucose uptake measurement. G, the primary cultured adipocytes from the knock-out mice were pretreated with (1000 nm) for 3 h and subjected to Western blot. H, immunoblot analysis of the dnEgr-1-overexpressing db/db mice after insulin challenge (2 units/kg of body weight). The transcriptional activity of Egr-1 was inhibited in diabetic db/db mice by injecting the dnEgr-1 adenovirus into epididymal fat pads. All of the groups of animal experiments contained at least five mice. * and #, p < 0.05, compared with the groups untreated with insulin; **, p < 0.01, compared with the adipocytes; ##, p < 0.01, compared with the control group of IR adipocytes. P-Erk1/2, phosphorylated Erk1/2; T-Erk1/2, total Erk1/2.

