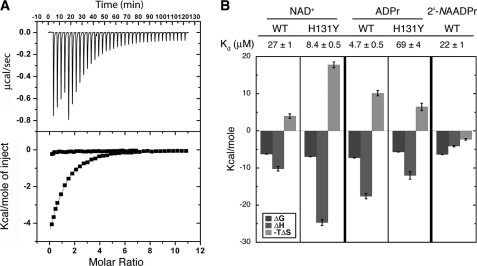
FIGURE 5.
Isothermal titration calorimetry studies. A, representative ITC trace. The top graph shows data obtained for 37 automatic injections (1–8 μl) of 1.4 mm NAD+ titrated into 27 μm SIRT6. The bottom graph represents integrated curves of the experimentally generated heats. The data were fitted to a one-site binding curve (solid line). NAD+ (1.40 or 1.63 mm) was titrated into 27 μm WT SIRT6 (■) or 50 μm Hst2 (●), respectively. B, dissociation constants and column graph displaying thermodynamic parameters for WT and H131Y SIRT6 binding to NAD+, ADPr, and 2′-NAADPr. NAD+ (1.40 mm or 767 μm) was titrated into 27 μm or 33 μm WT or H131Y SIRT6, respectively. ADPr (390 μm or 1.45 mm) was titrated into 28 or 37 μm WT or H131Y SIRT6, respectively. 2′-NAADPr (2.96 mm) was titrated into 38 μm WT SIRT6. The change in Gibbs free energy (ΔG) is shown in black. Change in enthalpy (ΔH) is shown is gray, and −TΔS is displayed in light gray. Error bars, S.D.

