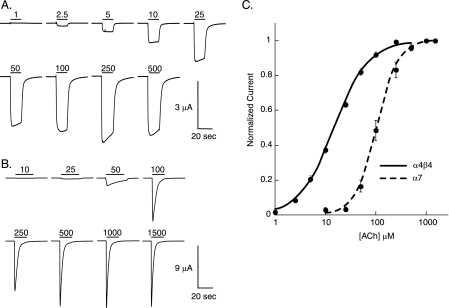
FIGURE 3.
Wild type recovery experiments. A, α4β4 nAChR; representative voltage-clamp current traces from oocytes with Trp incorporated by nonsense suppression at position TrpB. B, α7 nAChR; representative voltage-clamp current traces from oocytes with Tyr incorporated by nonsense suppression at position TyrC2. In A and B, bars indicate application of ACh (in μm) at concentrations noted. C, dose-response curve and fit of data in A and B to the Hill equation. The error bars indicate S.E. (n = 10–13).

