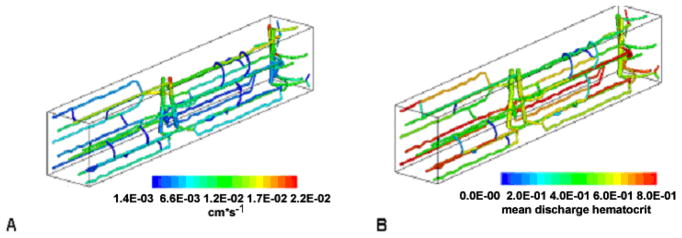
Figure 2.
Velocity (A) and hematocrit (B) distributions for a representative 100 μm by 100 μm by 800 μm capillary network in rat skeletal muscle. The figure is adapted from [13], where the equation-based models representing blood flow and oxygen transport are discussed.

