
Figure 6.
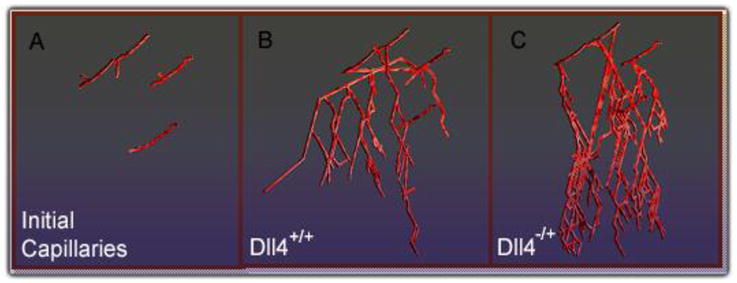
Snapshot of the model output directly after angiogenic stimulation (A) and for simulated hypoxia in Dll4+/+ conditions, after 160 hrs (B) and in Dll4−/+ conditions, after 160 hrs (C).
Official websites use .gov
A
.gov website belongs to an official
government organization in the United States.
Secure .gov websites use HTTPS
A lock (
) or https:// means you've safely
connected to the .gov website. Share sensitive
information only on official, secure websites.
Snapshot of the model output directly after angiogenic stimulation (A) and for simulated hypoxia in Dll4+/+ conditions, after 160 hrs (B) and in Dll4−/+ conditions, after 160 hrs (C).