
Figure 2.
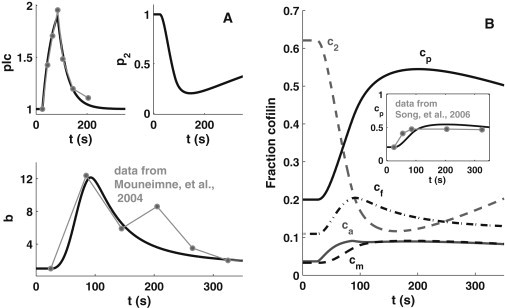
Dynamics of the system in response to EGF stimulation. Model results are obtained by simulation using the parameter values listed in Table 1. Experimental data (line segments connecting dots) are shown for comparison. (A) Time courses of PLC (plc), PIP2 (p2), and barbed-end (b) levels and data from Mouneimne et al. (1). (B) Fraction of total cell cofilin, vEcjE + vIcjI, for PIP2-bound (c2), F-actin-bound (cf), G-actin-bound (cm), phosphorylated (cp), and active (ca) cofilin. (Inset) Comparison of the simulation result of phosphocofilin, cp, and experimental data from Song et al. (17).