
Figure 4.
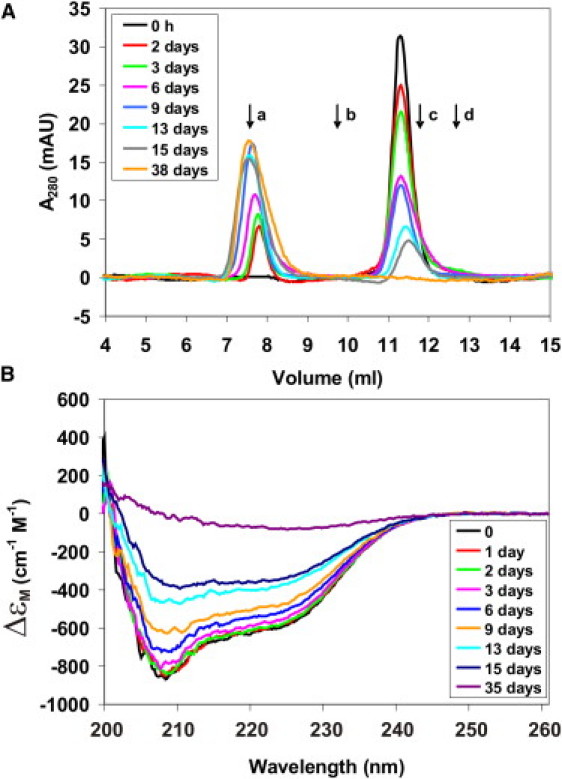
Josephin secondary structure changes upon aggregation. (A) SEC profiles and (B) far-UV CD spectra of 14 μM Josephin recorded at different time points during incubation at 37°C. (Arrows in A) Position of size markers: (a) Blue Dextran (7.79 mL); (b) Ovalbumin, 43 kDa (9.80 mL); (c) Chymotrypsinogen, 25 kDa (11.77 mL); and (d) Ribonuclease A, 13.7 kDa (12.81 mL). Note that Josephin (21.2 kDa) elutes as a protein with a slightly larger molecular mass because of its oblong shape.