
Figure 8.
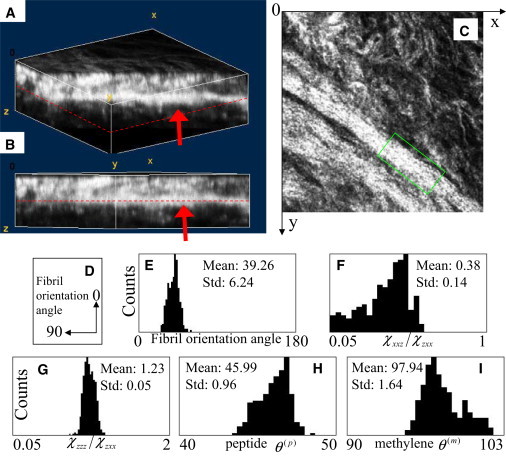
Three-dimensional SHG imaging and second-order susceptibility analysis of trachea cartilage. (A and B) Three-dimensional SHG image stack (95 × 95 × 30 μm3) of trachea cartilage. (C) SHG image of a section at 15 μm below the surface (indicated by dashed lines in A and B). Boxed region indicates region of well-aligned fiber used for localized second-order susceptibility analysis. (D) The definition of fibril orientation. (E–I) Histograms of fibril orientation angle, χxxz/χzxx, χzzz/χzxx, peptide pitch-angle θ(p), and methylene pitch-angle θ(m), respectively. Mean and standard deviations are summarized at Table 1 .