
Figure 1.
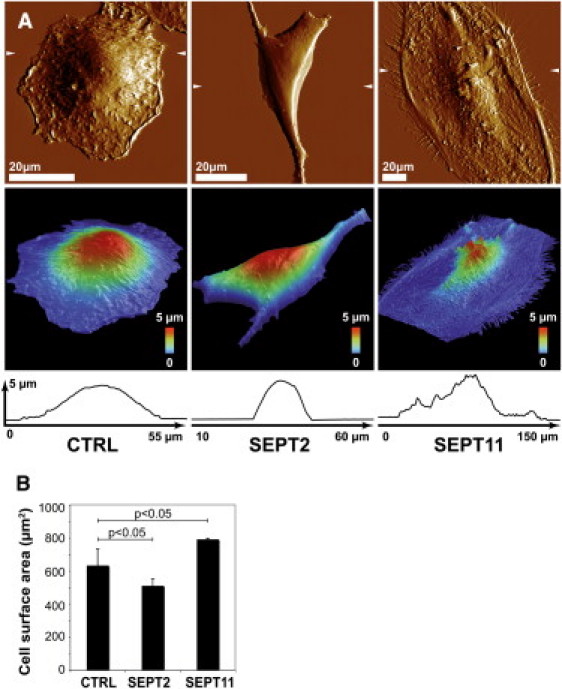
The impact of septin-depletion on cell shape. (A) AFM was used to examine cell shape and overall height of control (CTRL), SEPT2-, or SEPT11-depleted cells. (Top panels) AFM deflection images of cells recorded in contact mode at constant force. (Middle panels) Three-dimensional view of the height image with a pseudocolor scale ranging from low (blue) to high (red). (Arrows, top panels) Position of the cross-section profiles made on the height (bottom panels). One image representative of five is shown for each condition. (B) HCA microscopy was used to measure cell surface area of adherent CTRL (n = 98,356), SEPT2- (n = 156,823), or SEPT11- (n = 119,702) depleted cells. p-values, Student's t-test.