
Figure 2.
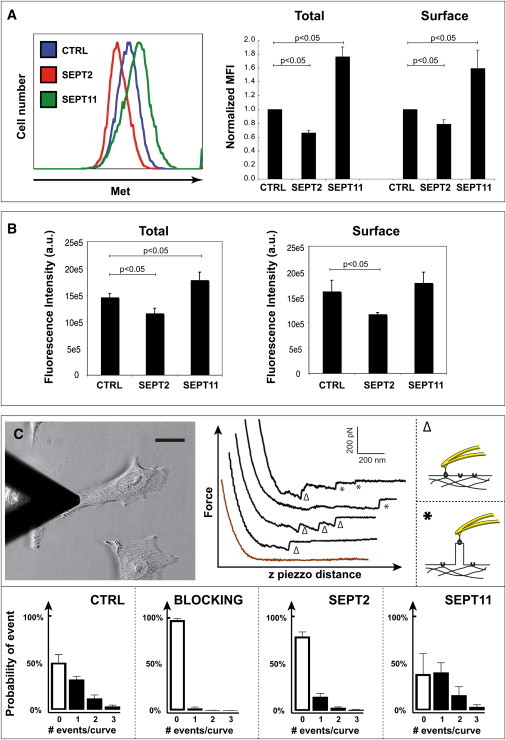
Septins regulate the level of Met protein. (A, left panel) Flow cytometry representative curves plot the intensity of total Met fluorescence (intracellular plus cell surface) for control (CTRL), SEPT2-, or SEPT11-depleted cells, where at least 10,000 events were acquired per sample. (Right panel) Median fluorescent intensity (MFI) ratios per sample were normalized by comparison with CTRL-transfected cells. (Graph) CTRL siRNA is figuratively presented as 1, and therefore does not have error bars, whereas the normalized MFI in septin-depleted cells are a relative value. Data represent the mean normalized MFI ratio mean ± SE from n ≥ 3 independent experiments for total (left histogram) and cell surface (right histogram) Met per siRNA treatment. p-values, Student's t-test. (B) HCA microscopy was used to measure the expression level of total (left panel) or surface (right panel) Met for CTRL, SEPT2-, or SEPT11-depleted cells. Raw values were obtained from four experiments per siRNA treatment. p-values, Student's t-test. (C) AFM force curve analysis of the InlB-Met interaction on living cells. (Top left panel) A tip functionalized with InlB is used to probe the cell surface (scale bar = 15 μm). (Top right panels) Representative examples of retraction force curves recorded at the surface of CTRL cells are shown. The curves displayed are (from bottom to top): no event (brown), single or multiple unbinding events, single and multiple tethers. Unbinding events are shown by Δ for V-shaped unbinding events and tethers are shown by asterisk (∗) for plateau events; probability of events are shown for cells treated with CTRL siRNA either with (i.e., blocking) or without InlB used as competitive inhibitor to demonstrate the specificity of the binding, and for cells treated with SEPT2 or SEPT11 siRNA. (Bar plots) Probability of having 0, 1, 2, or 3 events per retraction curve.