
Figure 4.
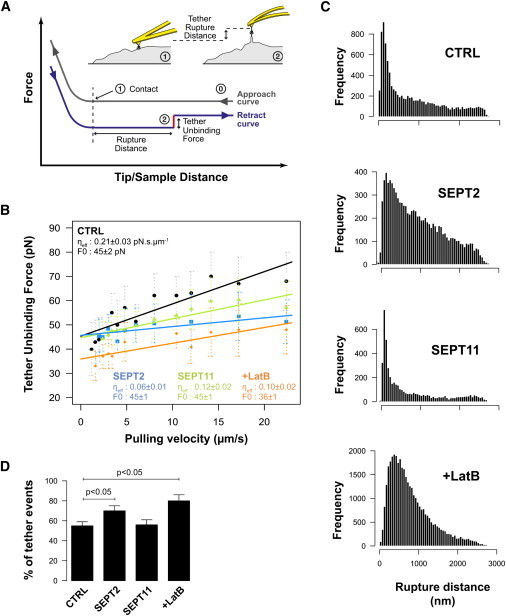
Impact of cytoskeleton disruption on membrane tethers. (A) Membrane tethers can be seen as force plateaus on retraction force curves. We measured the force of these plateaus (pN, red segment), as well as distance from the point of contact (nm, horizontal distance). (B) Tether unbinding force versus pulling velocity of the cantilever. Unbinding force increases linearly with the pulling velocity. SEPT2- and SEPT11-depleted cells show a smaller effective viscosity (ηeff) than control (CTRL) cells. Latrunculin B (LatB)-treated cells show a smaller effective viscosity as well as a smaller tether extraction force (F0) (n > 100 events/condition, mean ± SD). SEPT2- and SEPT11-depleted cell viscosities were significantly different (p-value = 0.012, GraphPad Prism two-tailed slope test). (C, Frequency histograms) Unbinding distances at 12 μm s−1 pulling velocity. CTRL and SEPT11-depleted cells show a clear peak soon after the point of contact whereas SEPT2-depleted cells show longer tethers in the same manner as LatB-treated cells. (D, Bar plots) Probability of having tether events. Data show mean ± SD. p-values, Student's t-test.