
Figure 5.
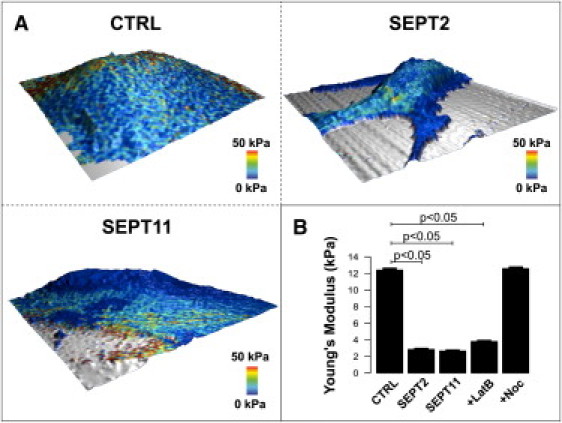
Cortical cell elasticity. (A) Representative three-dimensional elasticity heat maps of control (CTRL), SEPT2-, or SEPT11-depleted cells. Scan size is 50 μm2. In addition to topography is mapped the elasticity (Young's modulus) at 50 nm indentation. (Blue) Soft areas; (red) harder parts of the cell. (B) Mean elasticity values for CTRL, SEPT2-, or SEPT11-depleted cells, or latrunculin B (LatB)- or nocodazole (Noc)-treated cells (n = 20/condition with 1024 measurements per cell). Analysis was performed using 20,000 approach curves obtained from scan frames selected neither on the cell soma nor at the edge of the cell, and are summarized in a bar plot with mean ± SE error bars. p-values, Student's t-test.