
Figure 1.
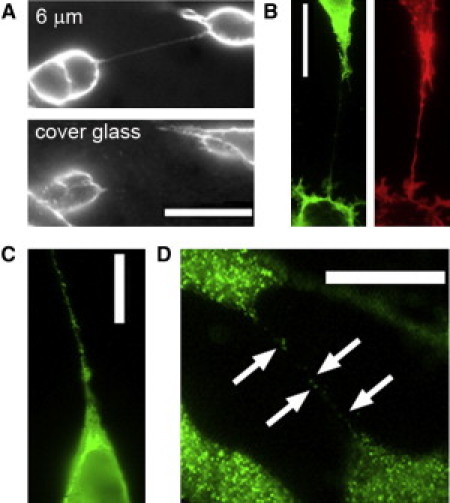
TNTs between cultured SH-SY5Y cells. (A) Cells stained with the fluorescent membrane dye Di-8-ANEPPQ showing a TNT suspended ∼6 μm above the coverglass. Images were obtained focused at the coverglass (bottom) and 6 μm higher (top). (B) Immunofluorescence staining for tubulin (green) and F-actin (red, phalloidin 647). (C) SH-SY5Y cell transfected 24 h previously to express ER-GFP showing the presence of ER in a TNT. (D) Immunofluorescence staining of type 1 IP3Rs along a TNT. All scale bars are 20 μm. Images are representative of ≥8 TNTs.