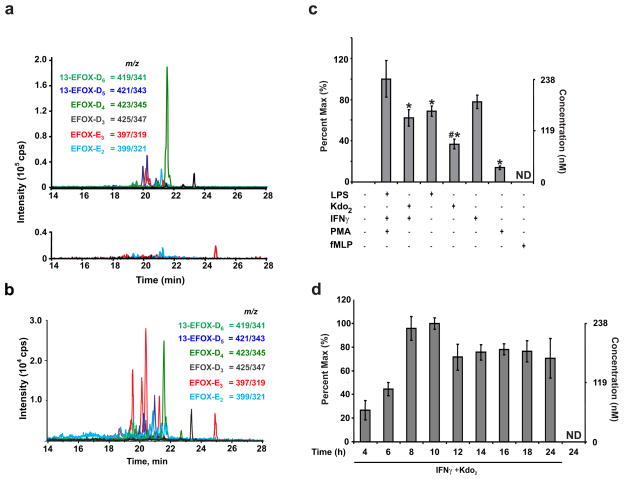
Figure 1. EFOXs are produced during macrophage activation.
a, MRM scans following the neutral loss of 78 reveal EFOXs adducted with BME in cell extracts from activated (upper) and non-activated (N/A, lower) RAW 264.7 cells. b, EFOX levels in PMA-differentiated THP-1 cells 8 h post activation. c, EFOX-D5 levels in RAW264.7 cells activated with the indicated compounds at the following concentrations: LPS (0.5 μg/ml), Kdo2 (0.5 μg/ml), IFNγ (200 U/ml), PMA (3.24 μM), fMLP (1 μM). Data are expressed as mean ± S.D. (n=4), where * = significantly different (p<0.01) from “PMA + IFNγ + LPS,” and # = significant difference (p<0.01) between “LPS” and “Kdo2 + IFNγ” (one-way ANOVA, post-hoc Tukey’s test). d, EFOX-D5 levels in RAW264.7 cells were quantified at the indicated time points post activation. ND indicates not detectable.

