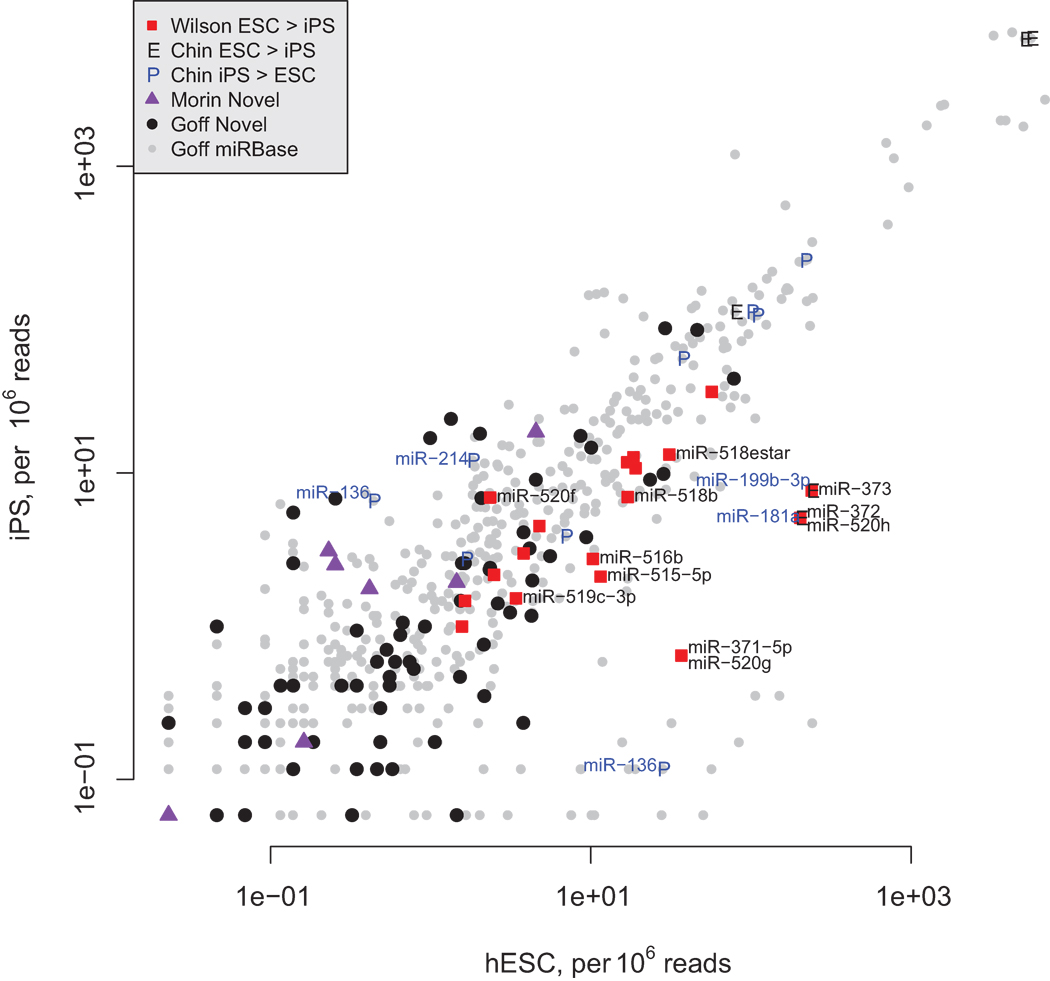
Figure 2.
Scatterplot of microRNA sequence frequencies (per 106 reads) in iPS or hESC taken from Goff et al. (2009) and highlighting overlapping microRNAs from Wilson et al. (2009), Chin et al. (2009) and Morin et al. (2008). MicroRNAs found to be enriched in hESC over iPS by Wilson are noted as red squares and those found to be at least 2-fold different in Goff are labeled in black. Among those microRNAs found to be ESC enriched by Chin, labeled with the character “E,” none was confirmed by Goff. However, several of those microRNAs found by Chin to be enriched in iPS (labeled “P”) are confirmed by Goff (labeled in blue to the left of the “P” character if they were at least 2-fold different). Note also the number of novel microRNAs found by Goff (black dots) that are enriched in iPS cells.

