
Figure 2.
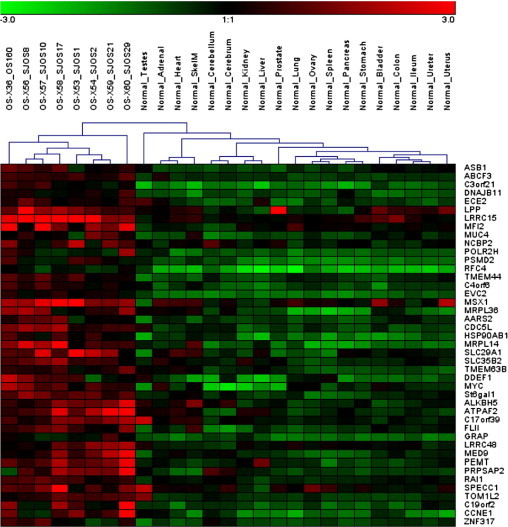
Genes in amplified regions that are overexpressed in mouse OS xenografts compared with normal tissues. Median normalized log2 expression levels for 214 of the 281 genes in regions of significant amplification across the OS tumors were compared between 8 OS and 19 normal tissue xenograft samples, as detailed in Materials and Methods. Genes determined to be overexpressed in the tumor samples (corrected P < 0.01, greater than twofold average expression) are depicted. The 8 samples on the left are OS xenografts and the 19 samples on the right are normal tissue controls, with the organ/tissue of origin indicated on each one individually. The genes differentially expressed are listed from top to bottom along the right edge of the heatmap. Red indicates high relative expression and green indicates low expression of genes.