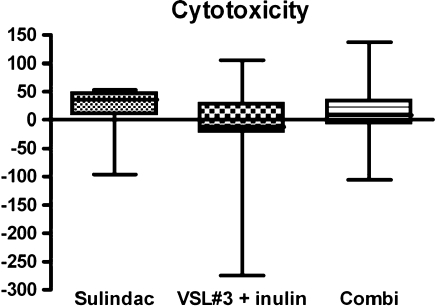
Fig. 4.
For each patient, the difference in cytotoxicity of fecal water at the end of the intervention period, minus cytotoxicity at start, was calculated. Median differences (solid line in each bar) in cytotoxicity are given for each intervention group. Bars represent 25% and 75% percentiles, and the minimum and maximum differences are also indicated (T bar). Number of patients involved are: sulindac, n = 7, VSL#3 + inulin, n = 9, sulindac + VSL#3 + inulin (combi), n = 15, P value (Kruskal–Wallis) = 0.19

