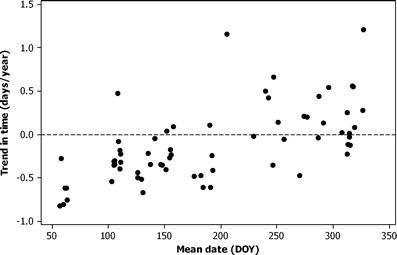
Fig. 1.

Trends through time (days/year) for 66 phenophases recorded at the Poznań Botanical Garden in the period 1977-2007 plotted against the mean date (day of the year) of the phenophase. A dotted reference line has been added; phases below the line got earlier, above the line later
