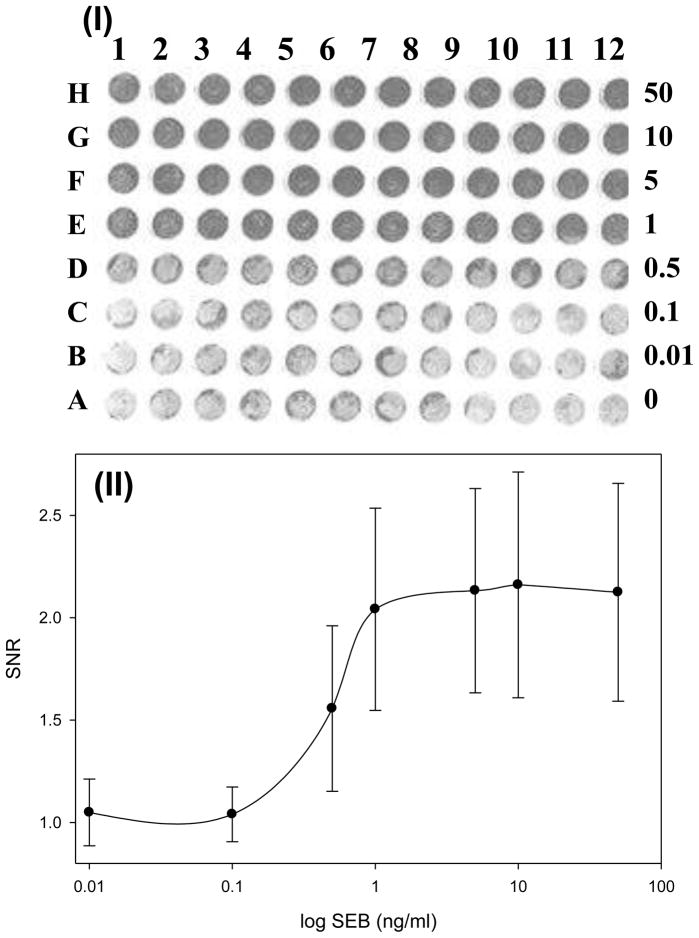
Figure 3. document scanner analysis of SEB detected with silver staining.
(I) document scanner image of the 96-well chip with different SEB concentrations. The binding was detected with gold-labelled secondary antibody, using silver enhancement. The wells contain, from bottom to top, 0, 0.01, 0.1,0.5,1,5,10, 50 ng/mL of SEB. Each concentration was measured 12 times (columns 1–12). (II) The corresponding plot of (I). Error bar = SD (n=12). The assay units are Signal to Noise Ratio (SNR), with each measured value divided by control (concentration 0 ng/ml)

