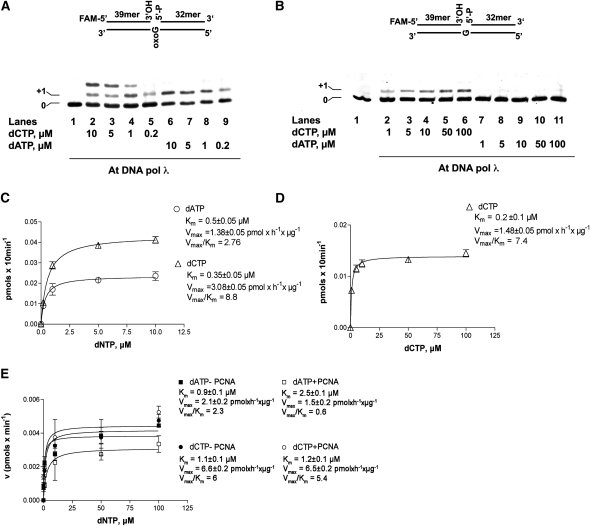
Figure 3.
PCNA2 Favors Error-Free Translesion Synthesis by DNA Pol λ Opposite the 8-Oxo-G Lesion.
(A) Incorporation was monitored with varying concentrations of dCTP (lanes 2 to 5) or dATP (lanes 6 to 9). Lane 1, control in the absence of nucleotides. The structure of the substrate is shown on top of the panel. The position of the band corresponding to the incorporation opposite the 8-oxo-G lesion (+1) is indicated at the left of the panel.
(B) Incorporation of dATP and dCTP opposite to a normal G by DNA pol λ was monitored with increasing concentration of dCTP (lanes 2 to 6) or dATP (lanes 7 to 11). Lane 1, control in the absence of nucleotides. The structure of the substrate is shown on top of the panel. The position of the band corresponding to the incorporation opposite the undamaged base (+1) is indicated on the left of the panel.
(C) Quantification of dCTP (triangles) and dATP (circles) incorporation opposite 8-oxo-G. The Km and Vmax values are reported for both nucleotides.
(D) Quantification of dCTP incorporation (triangles) opposite normal G. The corresponding Km and Vmax values are indicated. Values are the mean of three independent experiments. Error bars are ± sd.
(E) Variation of the initial velocity (v), induced by DNA pol λ on the 1-nucleotide gapped 8-oxo-G template for dCTP incorporation and in the presence (white circles) or in the absence (black circles) of At PCNA2 or for dATP incorporation in the presence (white squares) or in the absence (black circles) of At PCNA2 as a function of nucleotide substrate concentration. Values are the mean of three biological replicates. The corresponding Km and Vmax values are indicated. Error bars are ± sd.

