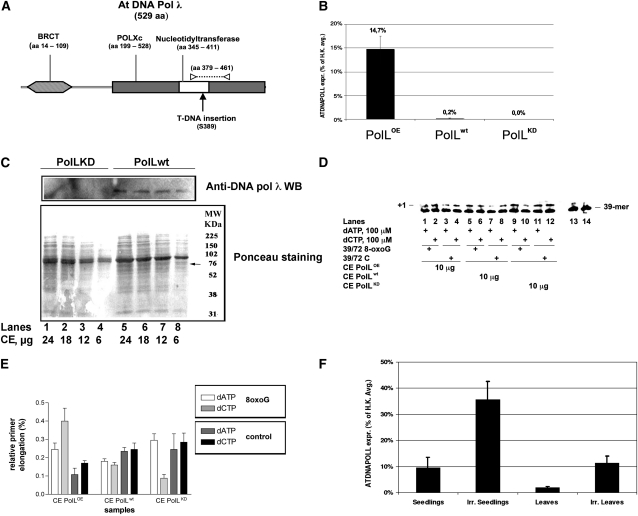
Figure 8.
Arabidopsis DNA Pol λ Is Responsible for Error-Free Bypass of 8-Oxo-G Lesion in Plant Cells.
(A) Schematic drawing of the protein domains encoded by DNA pol λ gene. Functional domains are reported. BRCT, BRCA-1 C-terminal domain; POLXc, DNA polymerase family X catalytic domain. The Ser-389 residue corresponding to T-DNA insertion is indicated by a black arrow. The portion of catalytic domain (amino acids 379 to 461) corresponding to amplicon produced by qRT-PCR with primers POLL FW and POLL RV is indicated by the dotted line. Primers position is reported as white triangles.
(B) Relative expression level of POLL in 10-d-old seedlings of different lines. qRT-PCR results show that POLL transcript levels in wild-type (POLWT), knockdown (POLKD), and overexpressing (POLOE) lines. Transcript levels are expressed as percentage of the average expression level of two housekeeping genes (H.K.): EF1α translation elongation factor (At5g60390) and glyceraldehyde-3-phosphate dehydrogenase C2 (At1g13440). POLL transcripts are ~14.7% of H.K in the overexpressing line and only 0.2% in Col-0. No expression was detected in knockdown line. Error bars represent ± sd of two technical replicates
(C) Protein gel blot analysis of the expression of DNA pol λ in wild-type (lanes 5 to 8) and KD (lanes 1 to 4) cell extracts (CE). Top panel: protein blot with anti-Hs DNA pol λ antibodies. Bottom panel: Ponceau staining of the same membrane. The migration position of DNA pol λ is indicated with an arrow.
(D) Reactions were performed with cell extracts under the conditions specified in Methods. POLLOE (lanes 1 to 4), POLLwt (lanes 5 to 8), or POLLKD (lanes 9 to 12) crude extracts (10 μg total proteins) were incubated in the presence of 100 μM dATP (lanes 1, 3, 5, 7, 9, and 11) or 100 μM dCTP (lanes 2, 4, 6, 8, 10, and 12) with the 39/72 8-oxo-G DNA substrate or with the 39/72 control DNA substrate. Lanes 13 (with 8-oxo-G substrate) and 14 (with control substrate) are control reactions in the absence of extracts.
(E) Relative activity, expressed as percentage of elongated primer ends, for dATP (light white bars) and dCTP (light-gray bars) in the 39/72 8-oxo-G DNA substrate and for dATP (dark-gray bars) and dCTP (black bars) in the 39/72 8-oxo-G DNA control substrate. Values are the mean of two independent biological replicates. Error bars are ± sd.
(F) qRT-PCR on 10-d-old seedlings and on mature leaves (30 d old) show a higher transcript level in young tissues, 9.5% (±4.1%) of H.K. versus 1.8% (±0.5%). After 30 min of UV irradiation (0.3 mW/cm2, corresponding to 2.9 J/m2/s, at 243-nm wavelength), transcript level was ~3.7-fold higher in seedlings and >6-fold higher in mature leaves, 35.5% (±7%) versus 11.3% (±2.7%). Error bars represent ± sd values among three independent biological replicates.

