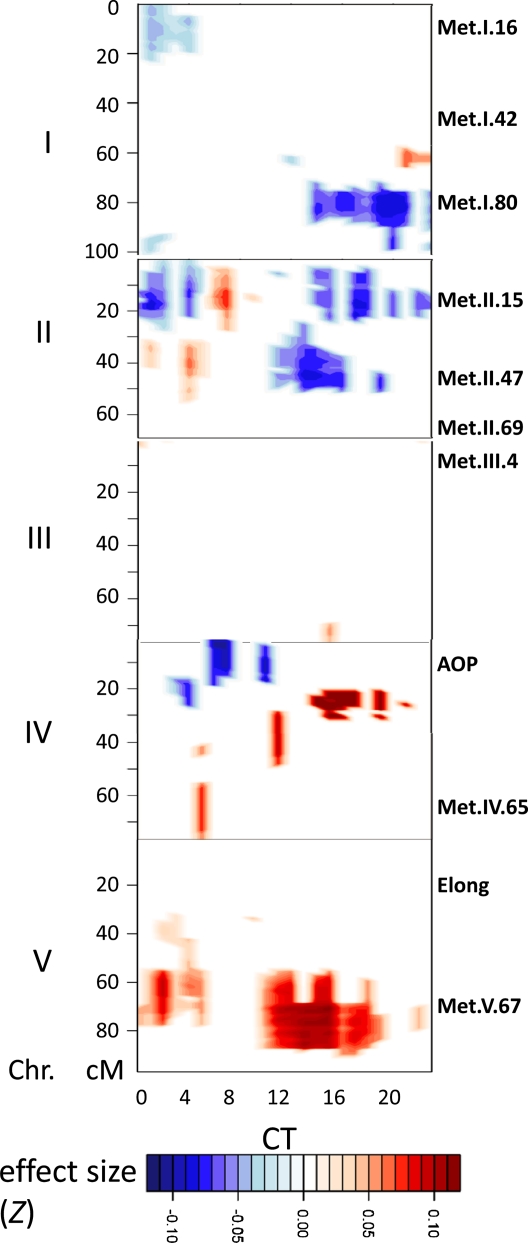
Figure 4.
Additive QTL Estimates across the Genome.
Shown is the range of predicted additive effects for all marker × phase group combinations in Z scale, with the direction and magnitude of the effect indicated by the color. Only the additive effects for marker × phase group positions that showed a significant QTL are presented, with all nonsignificant positions given a value of 0 to improve clarity. The x axis indicates the 24 different CT phase groups, while the y axis shows the genetic position on the five different Arabidopsis chromosomes (I to V). Labels along the right side of the y axis show the genomic position of metabolomic QTLs identified previously (Rowe et al., 2008).

