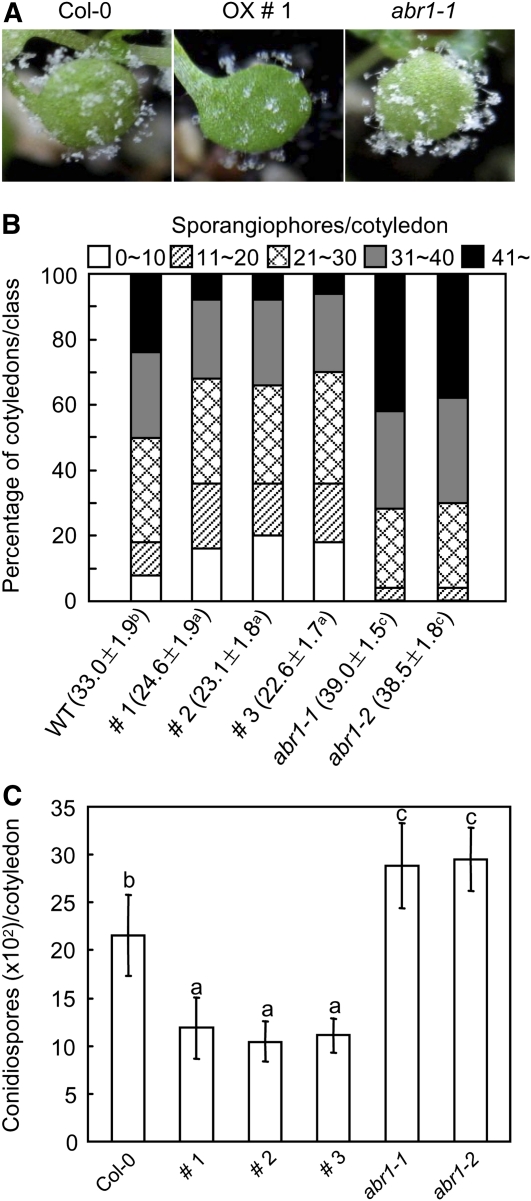
Figure 11.
Responses of Arabidopsis ABR1-OX Plants and ABA-Responsive Protein-Like abr1 Mutants to Infection with H. arabidopsidis Isolate Noco2.
(A) Visual images of diseased cotyledons 7 d after inoculation.
(B) Quantification of asexual sporangiophore formation on cotyledons 7 d after inoculation. The numbers at the bottom indicate the mean sporagiophores/cotyledon ± sd from three independent experiments. Different letters above sd indicate significant difference, as determined by Fisher’s protected LSD test (P < 0.05). The number of sporagiophores per cotyledon was determined and cotyledons were classified into five scales: 0 to 10, 11 to 20, 21 to 30, 31 to 40, and >40. WT, wild type.
(C) Numbers of conidiospores produced on >50 cotyledons 7 d after inoculation. Statistical analyses were performed using the LSD test. Different letters above the bars indicate significantly different means (P < 0.05).
[See online article for color version of this figure.]

