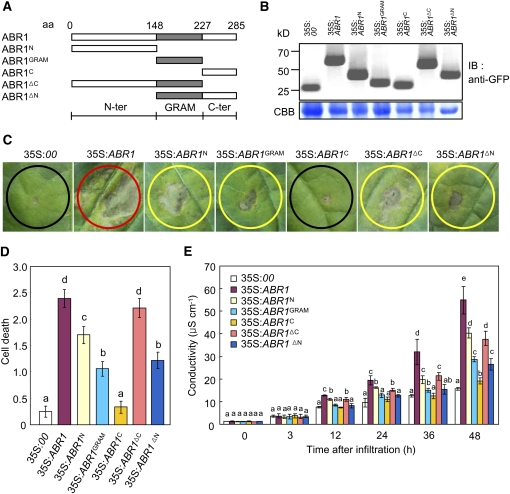
Figure 3.
Deletion Analysis of the GRAM Domain.
(A) Schematic of ABR1 structures used in the cell death assay and for protein localization. aa, amino acids.
(B) Expression of the ABR1 variant deletion proteins in pepper leaves, as detected by immunoblotting using an anti-GFP antibody. IB, imunnoblotting; CBB, Coomassie blue.
(C) Development of cell death responses in pepper leaves caused by infiltrating Agrobacterium (OD600 = 0.5) strains carrying different ABR1 constructs. Agrobacterium carrying an empty vector (35S:00) was used as a control. Red, yellow, and black circles indicate full, partial, and no cell death, respectively.
(D) The extent of ABR1 construct-induced PCD is classified with the following scales: 0, no PCD (<10%); 1, weak PCD (10 to 30%); 2, partial PCD (30 to 80%); and 3, full PCD (80 to 100%). The experiments were performed three times with similar results.
(E) Electrolyte leakages from leaf discs infiltrated by Agrobacterium (OD600 = 0.5) strains carrying different ABR1 constructs.
Error bars represent ± sd (n = 3) from three independent experiments and different letters (a to e) indicate significant differences, as determined by Fisher's protected least significant difference (LSD) test (P < 0.05) ([D] and [E])
[See online article for color version of this figure.]

