Figure 4.
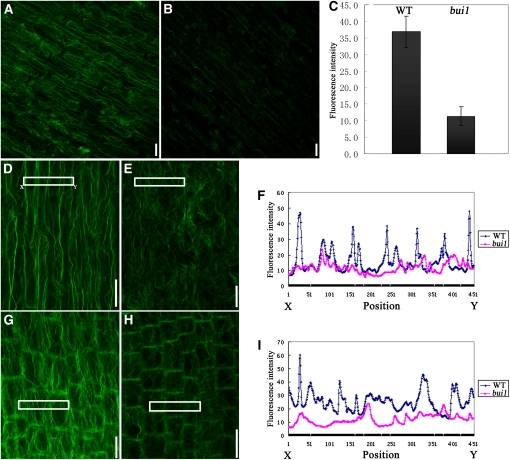
F-Actin Organization in Wild-Type and bui1 Cells.
F-actin organization was visualized by AlexaFluor488–phalloidin staining. Each image is a maximum projection of the fluorescence signals.
(A) and (B) F-actin organization in the cortex cells of the root elongation regions of the wild type (A) and bui1 (B). Bars = 20 μm.
(C) Quantitative analysis of F-actin levels in wild-type (WT) and bui1 cells as detected in (A) and (B). Data shown are means ± se of fluorescence intensity of 144 cells in the wild type and bui1. P < 0.01, by t test.
(D) and (E) F-actin organization in the root elongation region cells of the wild type (D) and bui1 (E). Confocal settings for bui1 were increased to give clear signals. Bars = 20 μm.
(G) and (H) F-actin organization in the root transition region cells of the wild type (G) and bui1 (H). Confocal settings for bui1 were increased to give clear signals. Bars = 20 μm.
(F) and (I) Fluorescence intensities corresponding to the regions marked in (D)/(E) and (G)/(H), respectively.

