Figure 6.
Visualization of the Effect of FH5 on Profilin/Actin Polymerization by TIRFM.
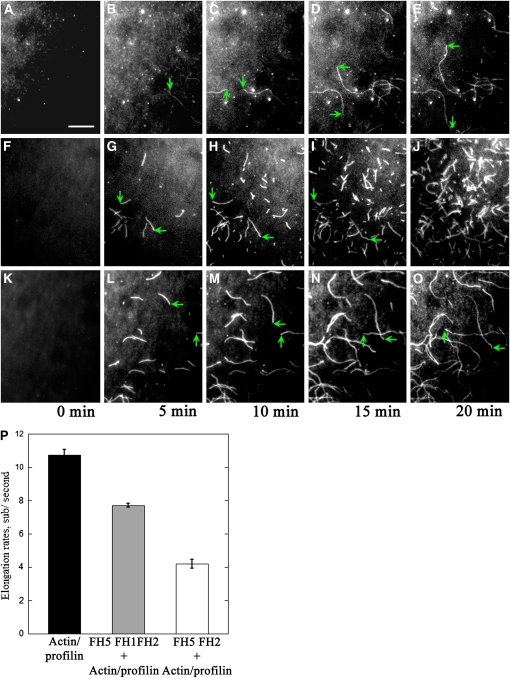
Time-lapse evanescent wave microscopy was conducted with 1.5 μM ATP-Oregon-green-actin (100% labeled) and 5 μM human profilin I in the absence or presence of FH5. Images were acquired at various times as indicated below the panels. The green arrows indicate the ends of typical actin filaments during elongation. Conditions were as follows: 10 mM imidazole, pH 7.0, 50 mM KCl, 1 mM EGTA, 1 mM MgCl2, 50 mM DTT, 0.2 mM ATP, 50 mM CaCl2, 100 μg/mL Glc oxidase, 15 mM Glc, 20 μg/mL catalase, and 1.0% methylcellulose. Bar = 10 μm.
(A) to (E) Time-lapse micrographs of profilin/Oregon-green-actin polymerization. The profilin/Oregon-green-actin complex was perfused into the flow cell coated with NEM–myosin. See also Supplemental Movie 4 online.
(F) to (J) Time-lapse micrographs of profilin/Oregon-green-actin polymerization in the presence of FH5 FH2. The profilin/Oregon-green-actin complex with 10 nM FH5 FH2 was perfused into the flow cell coated with NEM–myosin. See also Supplemental Movie 5 online.
(K) to (O) Time-lapse micrographs of profilin/Oregon-green-actin polymerization in the presence of FH5 FH1FH2. The profilin/Oregon-green-actin complex with 5 nM FH5 FH1FH2 was perfused into the flow cell coated with NEM–myosin. See also Supplemental Movie 6 online.
(P) The mean elongation rate (±se) of actin filaments. The elongation rates were measured with profilin/actin alone (10.8 ± 0.3; n = 17), profilin/actin plus 5 nM FH5 FH1FH2 (4.2 ± 0.3; n = 11), and profilin/actin plus 10 nM FH5 FH2 (7.7 ± 0.1; n = 17). P < 0.01, by ANOVA test.

