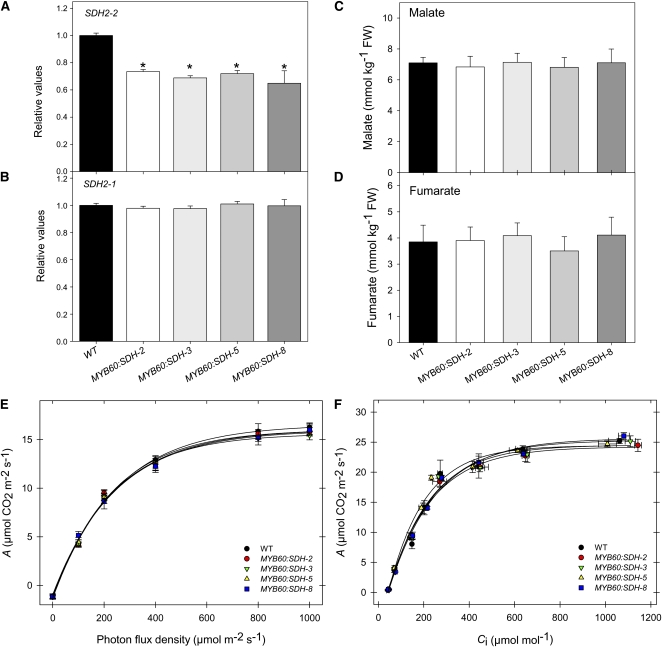
Figure 13.
Physiological Characterization of SDH2-2 Lines under the Control of the Guard Cell–Specific Promoter MYB60.
(A) and (B) Relative transcript abundance of mitochondrial Complex II subunits (SDH2-2 and SDH2-1, respectively). The abundance of SDH mRNAs was measured by quantitative RT-PCR. WT, wild type.
(C) and (D) Apoplastic concentrations of malate (C) and fumarate (D). Malate and fumarate were determined as described in Methods. FW, fresh weight.
(E) and (F) Assimilation rate as a function of PFD intensities (E) and net CO2 assimilation rate as a function of internal leaf CO2 concentration Ci (F). Values are presented as mean ± se of six individual plants per line. Asterisks indicate values that were determined by the Student’s t test to be significantly different from the wild type (P < 0.05).

