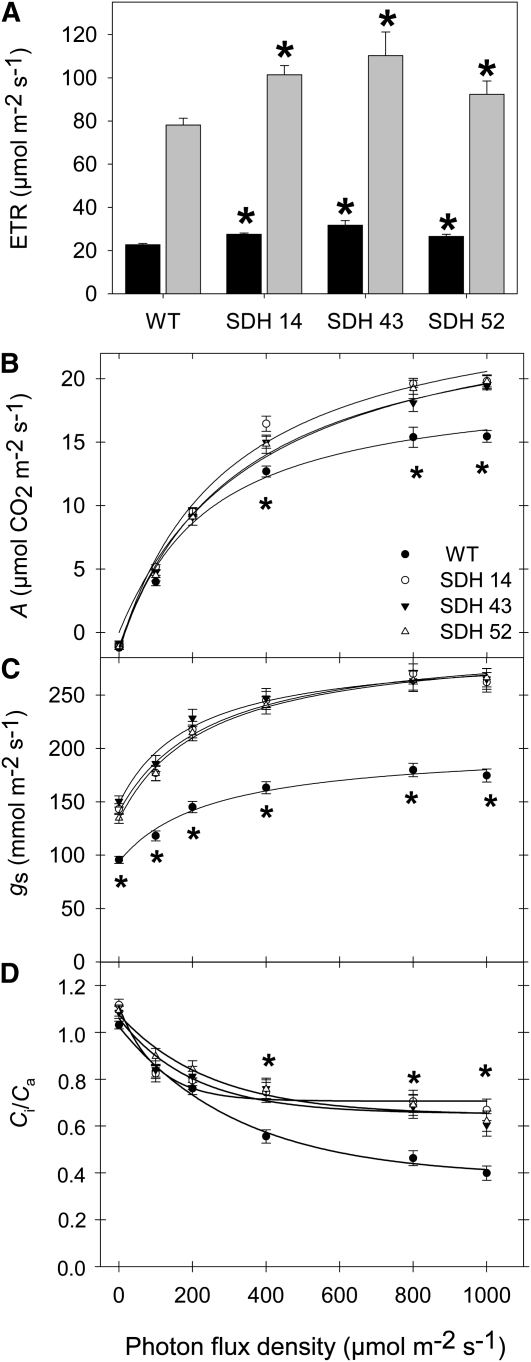
Figure 6.
Effect of Decreased Mitochondrial Succinate Dehydrogenase Activity on Photosynthetic Parameters.
(A) In vivo chlorophyll a fluorescence was measured as an indicator of the ETR using a PAM fluorometer at PFD of 100 (black bars) and 700 (gray bars) μmol m−2 s−1.
(B) Assimilation rate (A) as a function of PFD intensities.
(C) Stomatal conductance (gs) as a function of the intensity of PFD.
(D) Internal-to-ambient CO2 concentration ratio (Ci/Ca) as a function of the intensity of PFD.
Values are presented as means ± se of six individual determinations per line. All measurements were performed in 4- to 5-week-old plants. The lines used were as follows: the wild type (WT), black circles; SDH14, white circles; SDH43, black triangles; SDH52, white triangles. An asterisk indicates values that were determined by the Student's t test to be significantly different (P < 0.05) from the wild type.

