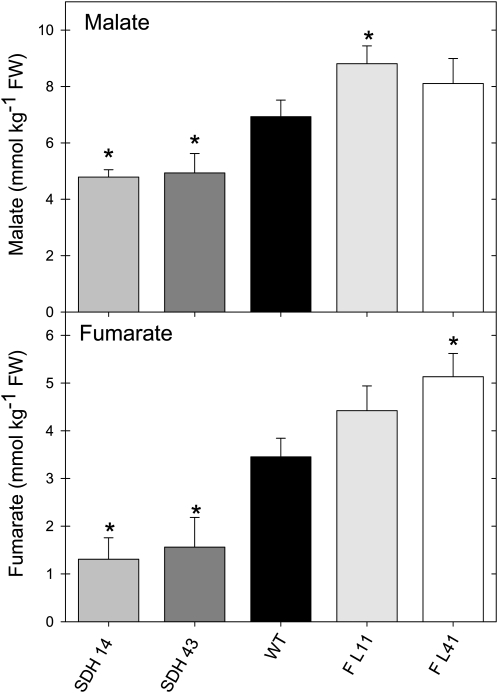
Figure 9.
Apoplastic Concentrations of Malate and Fumarate in Succinate Dehydrogenase and Fumarase Antisense Lines.
The apoplastic concentrations of malate (A) and fumarate (B) were determined as described in Methods. Values are presented as means ± se of six individual determinations per line. All measurements were performed in 4- to 5-week-old plants. The lines used were as follows: the wild type (WT), black bars; SDH14, gray bars; SDH43, dark-gray bars; FL11, light-gray bars; FL41, white bars. An asterisk indicates values that were determined by the Student’s t test to be significantly different (P < 0.05) from the wild type. FW, fresh weight.

