Figure 10.
FH5 FH1FH2 Bundles Actin Filaments in Vitro.
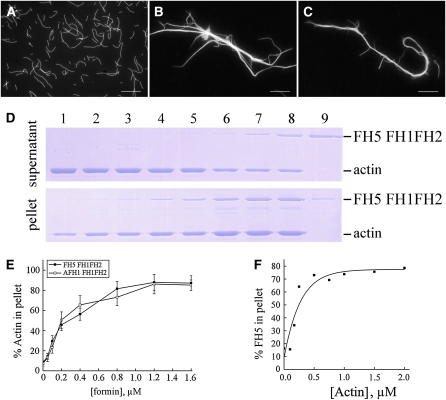
(A) to (C) Direct visualization of actin filament bundles in the presence of FH5 FH1FH2 or AFH1 FH1FH2. Micrographs were taken from reactions with actin filaments alone (A) or actin plus 800 nM of FH5 FH1FH2 (B) or AFH1 FH1FH2 (C).
(D) Low-speed cosedimentation assays to determine the bundling activity of FH5 FH1FH2. Lane 1, actin alone; lanes 2 to 8, actin plus 0.05, 0.1, 0.2, 0.4, 0.8, 1.2, or 1.6 μM FH5 FH1FH2, respectively; lane 9, 1.2 μM FH5 FH1FH2 alone.
(E) Percentage of actin filaments recovered in the low-speed pellet as a function of the concentration of FH5 FH1FH2 (closed squares) or AFH1 FH1FH2 (open squares).
(F) FH5 FH1FH2 binds to actin filaments. High-speed cosedimentation assays were performed to determine the apparent binding affinity of FH5 FH1FH2 to actin filaments. Various amounts of phalloidin-stabilized actin filaments were mixed with 0.5 μM FH5 FH1FH2. Percentage of F-actin–bound FH5 FH1FH2 was plotted against the concentration of actin and fitted with a hyperbolic function. For this representative experiment, Kd = 0.15 μM.
[See online article for color version of this figure.]

