Figure 11.
Colocalization of FH5 FH1FH2-RFP with Microtubules in Vivo and Binding and Bundling of FH5 FH1FH2 to Microtubules in Vitro.
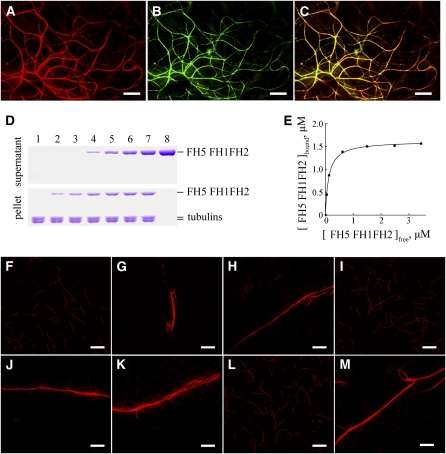
(A) to (C) Confocal images from onion epidermal cells expressing FH5 FH1FH2-RFP (A) and a microtubule marker, GFP-MAP4 (B). (C) shows merged signals from (A) and (B). Bars = 10 μm.
(D) Recombinant FH5 FH1FH2 protein is cosedimented with 1 μM taxol-stabilized microtubules. Recombinant FH5 FH1FH2 protein appeared mainly in the supernatant after centrifugation in the absence of microtubules and cosedimented with microtubules into the pellets. The concentration of FH5 FH1FH2 in lanes 1 to 8 was 0, 0.5, 1.0, 2.0, 3.0, 4.0, 5.0, and 5.0 μM, respectively.
(E) Increasing concentrations of FH5 FH1FH2 (0.5 to 5.0 μM) were incubated and cosedimented with 1.0 μM microtubules. The concentration of microtubule-bound FH5 FH1FH2 was plotted against the concentration of free FH5 FH1FH2 and fitted with a hyperbolic function. For this representative experiment, the Kd was 0.12 μM.
(F) to (M) Micrographs of rhodamine-conjugated microtubules in the absence or presence of formins. (F) Microtubules alone; (G) microtubules plus 3.0 μM FH5 FH2; (H) microtubules plus 5.0 μM FH5 FH2; (I) microtubules plus 5.0 μM denatured FH5 FH2; (J) microtubules plus 1.5 μM FH5 FH1FH2; (K) microtubules plus 2.5 μM FH5 FH1FH2; (L) microtubules plus 2.5 μM denatured FH5 FH1FH2; (M) microtubules plus 1.5 μM AFH14 FH1FH2. Bars = 20 μm.

