Figure 4.
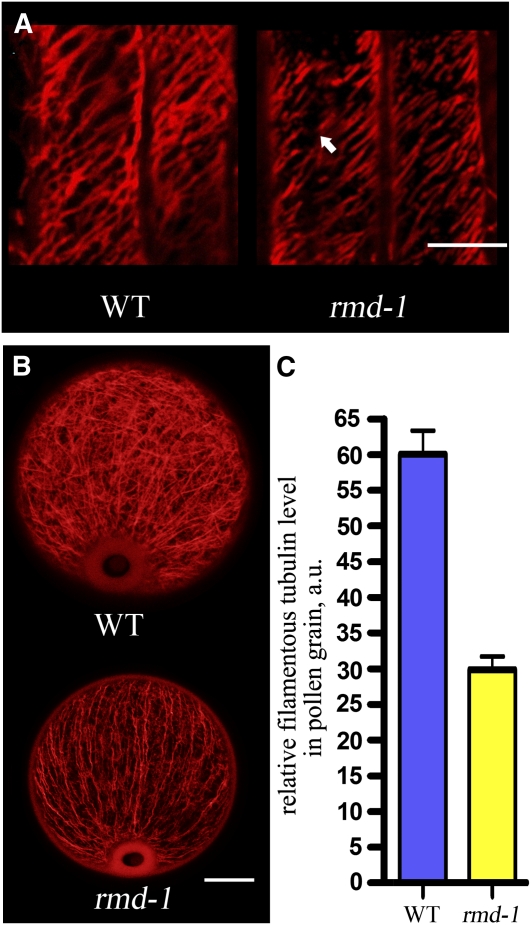
The rmd Mutant Has Defective Microtubule Array.
(A) Microtubule arrays in the wild-type (WT) and rmd-1 root cortical cells. The arrow in rmd-1 indicates fragmented microtubule array. Bar = 20 μm.
(B) Microtubule arrays in the wild-type and rmd-1 pollen grains at stage 13 of anther development. Bar = 10 μm.
(C) The average fluorescence pixel intensity (±se) in each pollen grain was 60.07 ± 3.26 (n = 27) in the wild type and 29.87 ± 1.86 (n = 29) in rmd-1 (P < 0.001)
[See online article for color version of this figure.]

