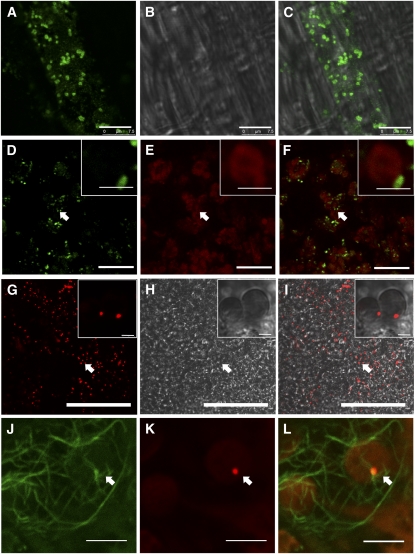
Figure 6.
Subcellular Localization of FH5.
(A) to (C) Immunostaining analysis of FH5 localization in rice leaf cells.
(A) Immunological assay of FH5 showing the signal distribution in the cytoplasm.
(B) Bright field of (A).
(C) Merged signals of (A) and (B). Bars = 7.5 μm in (A) to (C).
(D) to (F) Immunostaining analysis of FH5 localization using rice leaf cells digested by cellulase and pectinase.
(D) Immunological assay showing FH5 signal at the outer membrane of chloroplasts (green signal).
(E) Chloroplast autofluorescence (red signal).
(F) Merged signals of (D) and (E). Insets in (D) to (F) are the close-ups of regions pointed out by the arrows. Bars = 10 μm in (D) to (F) and 1 μm in the insets.
(G) to (I) Analysis of FH5 PTEN-RFP subcellular localization in tobacco leaf cells. Insets are close-ups of the regions pointed out by the arrows.
(G) FH5 PTEN-RFP signals in the cytoplasm.
(H) Bright field of (G) showing chloroplasts.
(I) Merged signals of (G) and (H). Bars = 50 μm in (G) to (I) and 2.5 μm in insets. The control images are in Supplemental Figure 10 online.
(J) to (L) Analysis of the association between FH5 PTEN-RFP and microfilaments in tobacco leaf cells. Bars = 5 μm.
(J) Microfilaments (green signals) stained by Alexa Fluor 488-phalloidin.
(K) FH5 PTEN-RFP (red signals) indicated by the arrow.
(L) Merged signals of (J) and (K) showing the localization of FH5 PTEN-RFP on the outer envelope membrane of chloroplasts and its association with the microfilaments in the cytoplasm.

