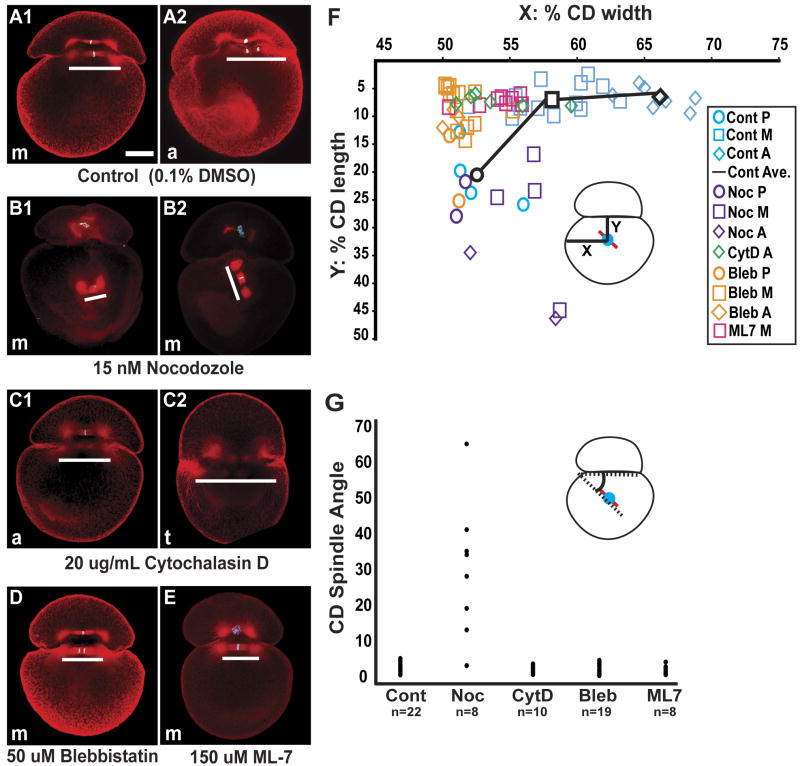
Figure 4. Drug-specific disruption of MA dynamics.
(A-E) Confocal images of control and drug treated embryos, stained for tubulin (red) and histone (blue), when sibling controls were at metaphase (m), anaphase (a) or telophase (t); white bars parallel each spindle. (A1-2) Control embryos cultured in media with DMSO at a concentration equivalent to that used in the drug treatments. (B-E) Examples of embryos treated with drugs continuously from 265′ AZD until fixation, 110-140 minutes later. (B1-2) in embryos treated with low levels of nocodazole, one or both asters fail to attach to the AB/CD interface, so that the position and angle of the spindle are highly variable; cortical staining is also reduced. (C1-2) In embryos treated with cytochalasin D, both spindle poles remain in contact with the interface, but the MA does not move towards the right side of the embryo, and the spindle are longer than in controls (C2). (D and E) In embryos treated with either blebbistatin or ML-7, the spindle poles remain in contact with the interface and the spindle length is normal, but the MA does not move rightward. (F) Graphical representation of spindle midpoint position (inset) in controls and drug treatments at various time points in mitosis. P (prophase), M (metaphase), A (anaphase); The black line shows the progression of the average position of the spindle mid-body for the control embryos. (G) Distribution of CD spindle-interface angles (inset) measured in a total of 67 control and drug treated embryos. Scale bar, 100 microns.

