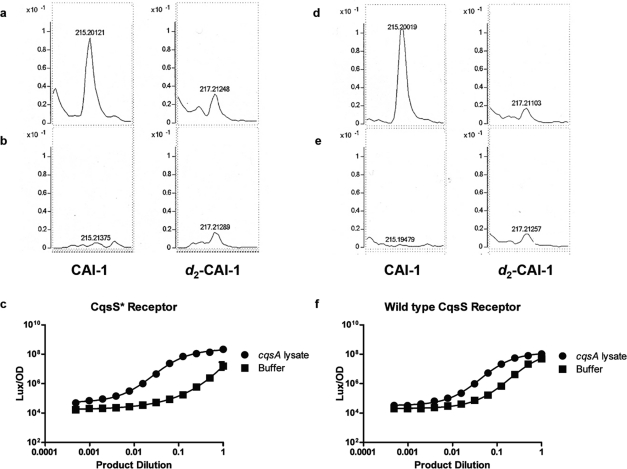
Figure 5.
Conversion of Ea-CAI-1/DK-CAI-1 to CAI-1. Conversion experiments were performed with a V. cholerae cqsA lysate (a, d) or lysis buffer (b, e) providing Ea-CAI-1 (a−c) or DK-CAI-1 (d−f) and excess NADPH. In a, b, d, and e, HRMS spectra are enlarged to show peaks for CAI-1 and for the internal standard, d2-CAI-1, as noted. In c and f, dose responses measured by light production are shown for the CqsS* receptor for Ea-CAI-1 to CAI-1 conversion (c) and for the wild-type CqsS receptor for DK-CAI-1 to CAI-1 conversion (f). Products were diluted as noted for reactions with cqsA lysate (●) and buffer (◼).

