Figure 3.
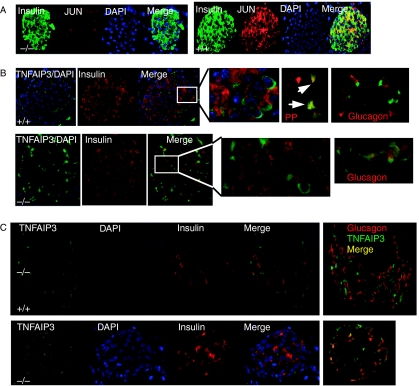
(A) Protein expression of JUN in UCP2+/+ and UCP2−/− islets detected by immunohistochemistry. When images were merged, co-localization of insulin (green) and JUN (red) was detected as yellow in UCP2+/+ islets. The intensity of JUN staining also appeared more intense in the UCP2+/+ sections. (A) Representative photomicrographs showing localization of TNFAIP3 in islets by immunohistochemistry. TNFAIP3 (green) and insulin (red) were independently detected in islets from UCP2+/+ (top) and UCP2−/− (bottom) mice. Nuclei were visualized with DAPI. Merged images indicated that in UCP2+/+ islets, TNFAIP3 was detected mainly in the perinuclear region of non-β-cells (top, expanded from inset). There was co-labeling of TNFAIP3 with some pancreatic polypeptide-expressing cells (arrows) but not glucagon-labeled cells (far right). In UCP2−/− islets, TNFAIP3 was detected not only in the perinuclear regions of non-β-cells but also in the cytoplasm of cells co-staining for insulin (bottom, expanded from inset). In UCP2−/− islets, co-staining of TNFAIP3 and glucagon was detected (far right). (C) Effects of STZ treatment on TNFAIP3 immunostaining in islets. Tissues were obtained 14 days after STZ administration. In UCP2+/+ islets (top), TNFAIP3 staining was confined to non-β- and non-α-cells. Islets from UCP2−/− mice (bottom) expressed TNFAIP3 in most α-cells.

