
Figure 2.
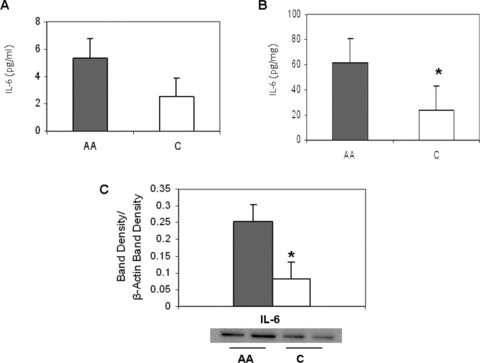
Racial differences in Interleukin‐6 (IL‐6) levels. (A) African American (AA) and Caucasian (C) human plasma. (B) Basal HUVEC culture, AA and C. Values normalized to protein content. (C) IL‐6 protein expression levels in AA (shaded) and C (open) basal HUVEC culture. ImageJ densitometric analysis of bands expressed in relation to b‐actin. Bars show mean ± SE. *p < 0.05 between ethnic group.