
Figure 4.
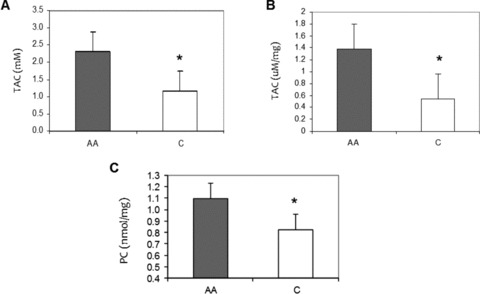
Racial differences in oxidative‐stress markers. (A) Total antioxidant capacity (TAC) levels in African American (AA) and Caucasian (C) human plasma. (B) TAC levels in basal AA and C HUVEC culture. (C) Plasma Protein Carbonyl (PC) levels in AA and C human plasma. Values normalized to protein content. Bars show mean ± SE. *p < 0.05 between ethnic group.