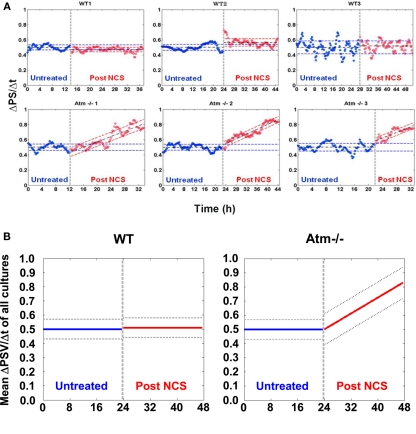
Figure 12.
Phase synchronization variations. Part (A) shows the variation in the phase synchronization between successive time windows, 15 min apart, as is explained above. Three WT cultures are presented in the top row and three Atm−/− are presented at the bottom. The SE are shown as dashed colored lines The results prior to DNA damage induction (marked by a dashed vertical gray line) are in blue, whereas post induction are in red. Prior to DNA damage induction the mean values are shown as dashed black lines. Each plot is normalized so that the mean value is exactly 0.5. As opposed to WT cultures, Atm−/− networks presents an increase in variation following the induction of DNA damage with Neocarzinostatin (NCS). The dashed black line following NCS application represents the least mean square (LMS) fit for the samples rather than the mean value. In (B) we show the mean levels of the slope and STD of the results for the three WT and the three Atm−/− networks respectively.

