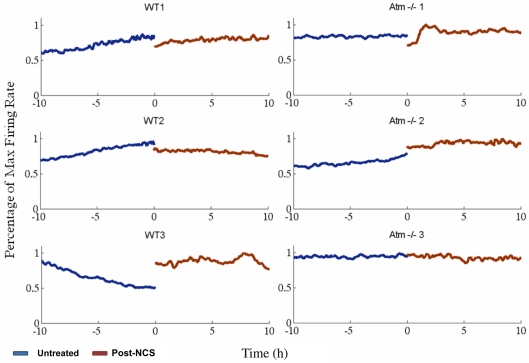
Figure 4.
Number of spikes detected in windows of 1000s with 250s steps. Blue lines indicate untreated networks, brown lines post NCS treatment. On the left: three examples of WT cultures, on the right: three Atm−/− samples. Though global firing rates vary across different cultures – representing the unique nature of each respective disassociated neural network – we cannot detect any firing rate motifs unique to wild type or Atm−/− cultures nor can we detect any consistent changes following exposure to DNA damage inducing agent Neocarzinostatin. WT3 shows anomalously decreasing activity until circa 2 h prior to NCS application.

