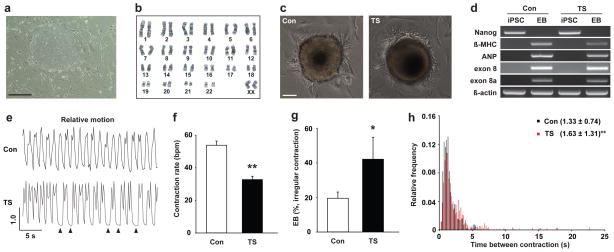
Figure 1. Generation of cardiomyocytes from control and TS iPSCs.
a) Phase contrast images of iPSC line (9862-61) derived from a TS patient. Scale bar, 400 μm. b) Karyogram of TS iPSCs (7643-5). c) Images of spontaneously contracting embryoid bodies (EBs) generated from control (Con, left) and TS iPSCs (right). Scale bar, 100 μm. d) Examination of pluripotent and cardiac gene expression using RT-PCR with primer sets for pluripotent gene (NANOG), cardiac markers (β-MHC and ANP), CaV1.2 channels (exon 8 and 8a) and house keeping gene (β-actin). e) Relative motion of contracting control and TS EBs. Arrowheads show missing contractions. f) Contraction rate of TS and control EBs (control, n=85 EBs in 5 lines; TS, n=113 in 5 lines, mean ± s.e.m.). g) Fraction of TS and control EBs showing arrhythmic contractions (control, n=5 lines, 85 EBs; TS, n=5 lines, 113 EBs, mean ± s.e.m.). h) Histogram of inter-contraction intervals for control EBs (black column, n=3,241 contractions in 5 lines) and TS EBs (red column, n=3,998 in 5 lines, mean ± s.d.). Statistical analyses were conducted using Student’s t-test (*P<0.05, **P<0.01).

